Case Study
Medium: UX Research
A sentiment and zero-shot classification analysis on user reviews
📋
6,733 reviews analysed
📈
16 interactive plots
🐍
Code available
🙃
2 Sentiment models tested
🎯
10 UX topics investigated

Medium UX Case Study

Giovanni Gilberti
Strategic & Product Designer
available for work
🛠️ Project blueprint
Overview
Over 6,500 reviews of the Medium mobile application were analysed leveraging a variety of Python libraries in a Jupyter Notebook environment. These libraries included Pandas and NumPy for data manipulation and computation, and Bokeh for data visualization. Additionally, the Hugging Face Transformers library was used to implement models for sentiment analysis and zero-shot classification.
The models used to perform the analysis are:
Zero-shot classification: DeBERTa-v3-large-mnli-fever-anli-ling-wanli
Data
Data
Source 1
Data
Source 2
Environment
Conda
Project virtual environment
Python 3.11.5
Language
VS Code
IDE
Jupyter Notebook
Analysis environment
Main libraries
Pandas
Data manipulation
Numpy
Numerical computation
Bokeh
Data visualisation
Hugging Face
Model implementation

NLTK
Sentiment analysis
About Medium
Medium is an American digital-only publishing platform that allows both amateur and professional writers to share content on a variety of topics. These topics range from personal stories to in-depth analyses on technology, politics, design, among others.
Medium combines aspects of social media and traditional blogging, enabling users to interact, comment, and discuss with each other. It also offers a partner program, where writers can earn money based on reader engagement.
The platform operates on a subscription business model, giving subscribed users access to a selection of articles. Unlike traditional ad-based revenue models, Medium's subscription-based approach ensures a steady stream of income that supports the platform and its contributors. This model enables the platform to prioritise high-quality content over ad revenue-driven articles.

Home page
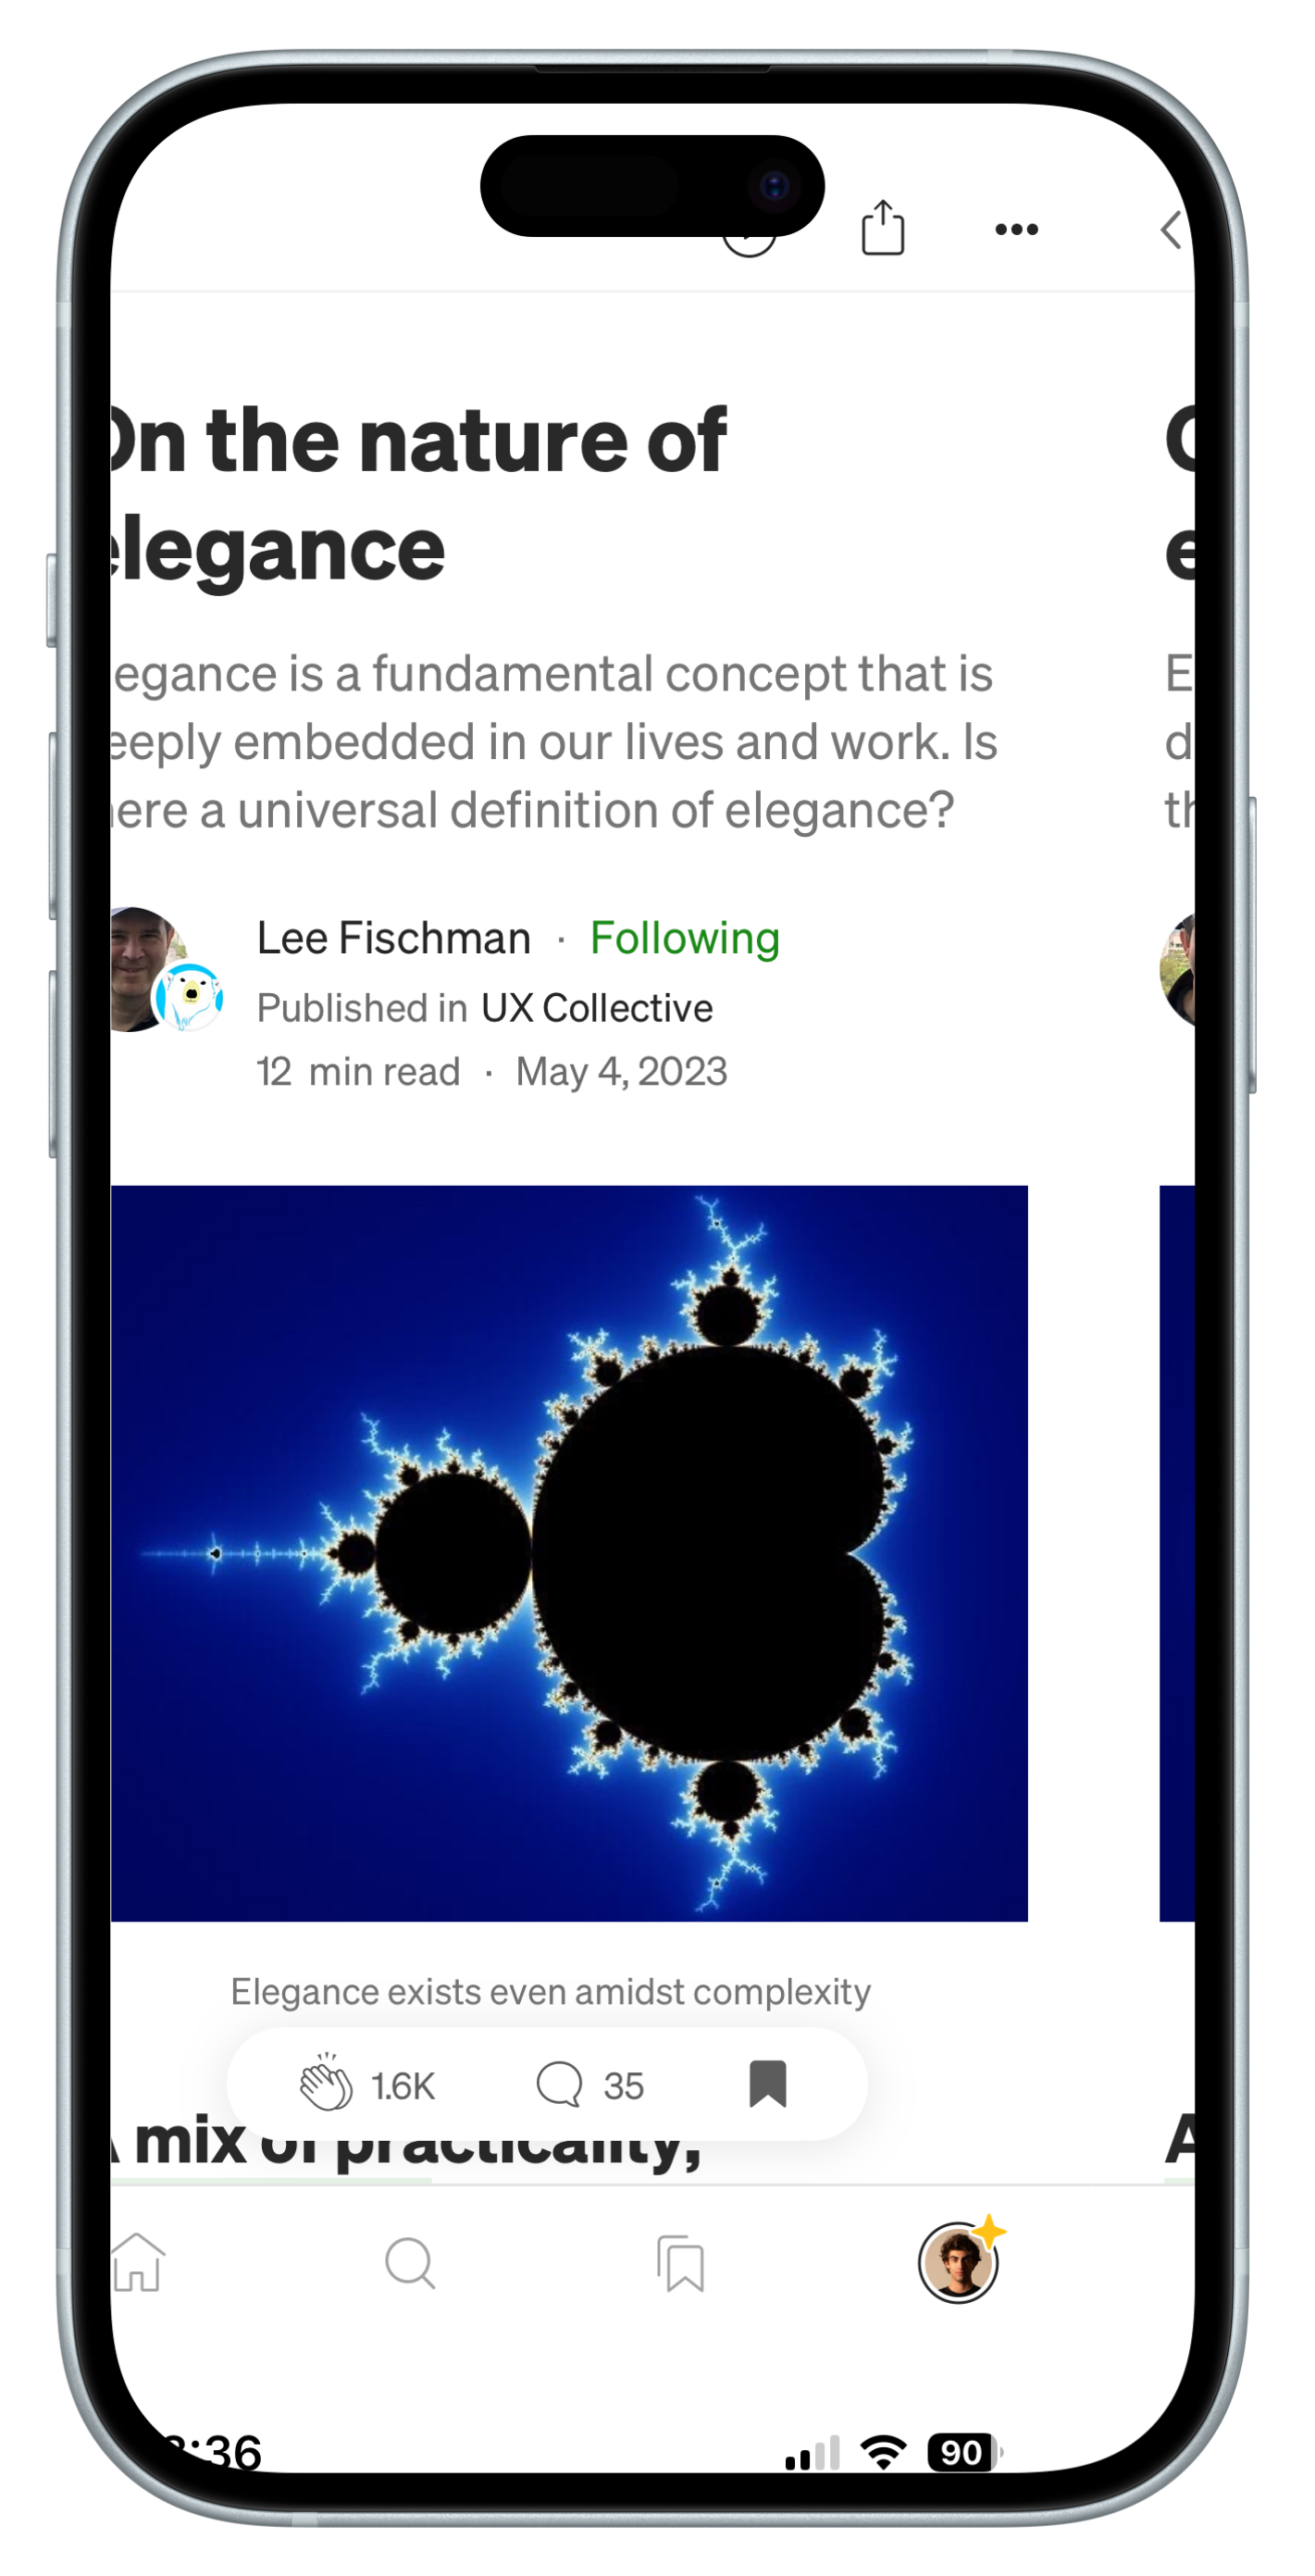
Article page
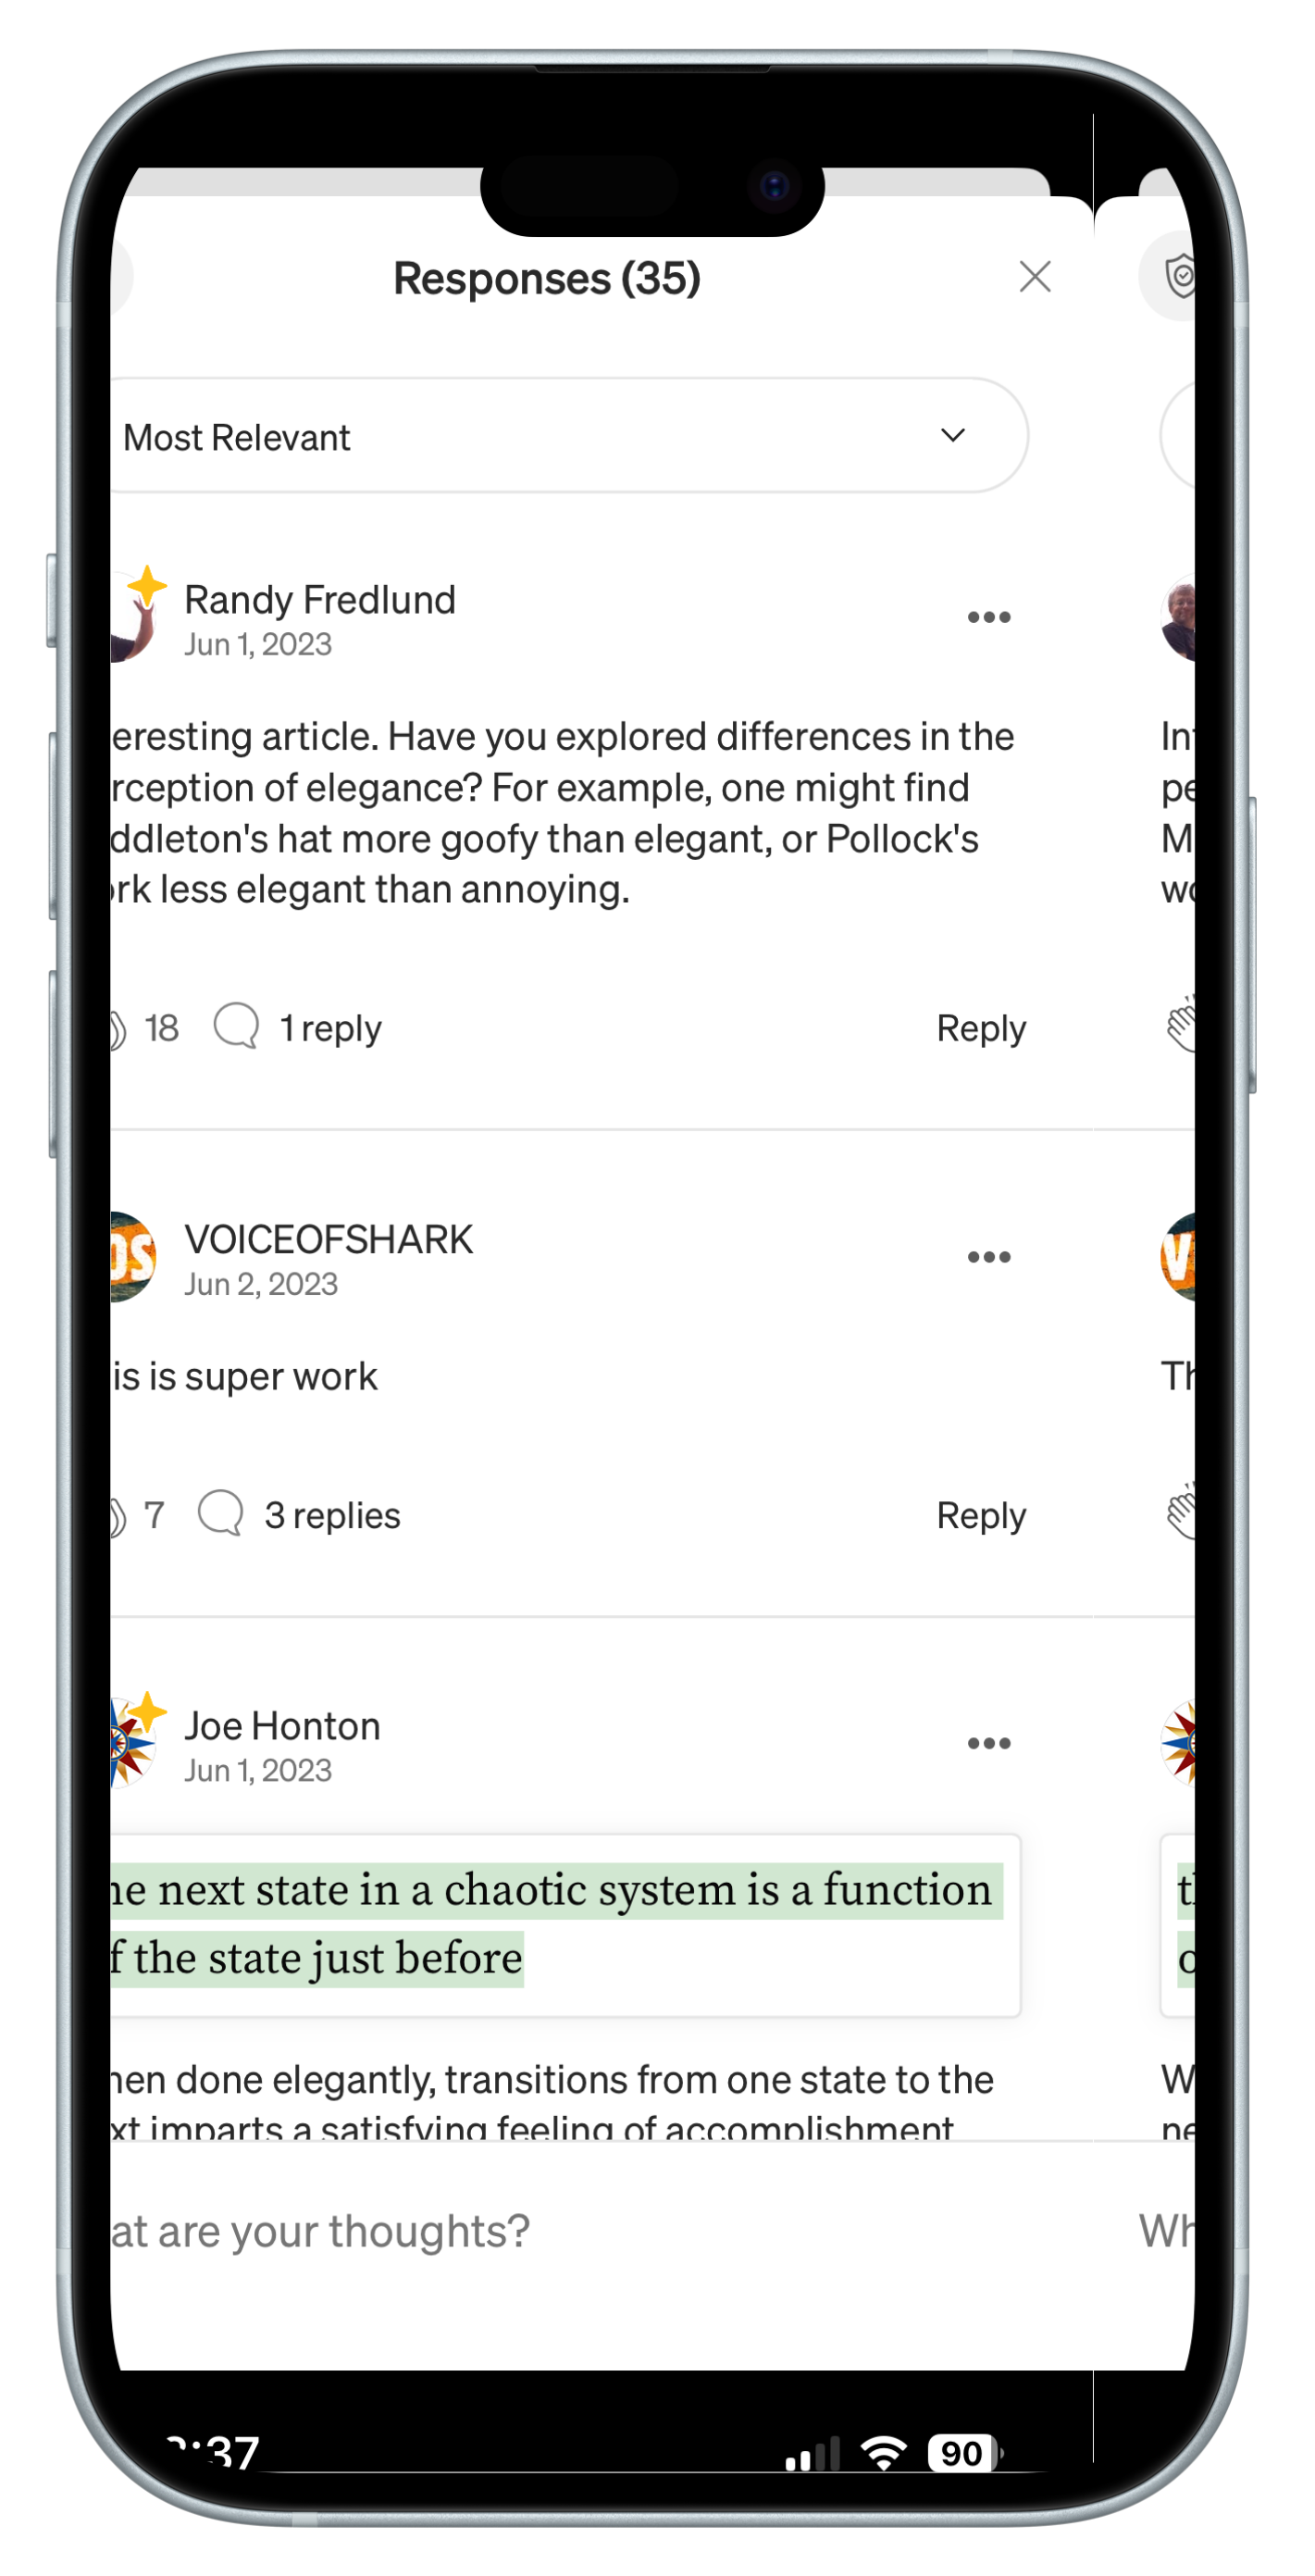
Comment section
🎯 Project scope
Analysing review patterns and trends: study customer reviews to identify recurring themes and fluctuations over time
Identifying key discussion topics: identify the main subjects that are frequently mentioned in the reviews
Understanding sentiment: understand the emotions and attitudes expressed in the discussions about these topics
Gathering actionable insights: extract valuable information that can be utilized in a UX/UI redesign case study
Interactive plots
Most of the plots can be explored interactively by hovering, zoom and pan!
🚁 Executive summary
More than 6,500 reviews related to the Medium mobile application have been analysed, focusing on their text content, user ratings, sentiment scores, and topics of discussion, to name a few.
After collecting such publicly available reviews, their integrity and general quality were audited, revealing two main issues:
The dataset contains reviews that appear to be comments on articles.
The dataset includes reviews whose content is completely unrelated to the app or its articles.
After removing the reviews identified as belonging to these two categories, statistical analysis was performed. The application shows a very high number of reviews with a 5-star rating (4,596 out of 6,733), with an average of 10.1 words written for each review (standard deviation: 17.7).
Following this initial exploration, sentiment analysis methods (VADER and BERT) were adopted to gain a more granular understanding of the reviews' content.
Finally, zero-shot classification was performed to determine the extent to which each of the aforementioned reviews was related to the following topics (labels):
Among these, the most discussed topics were content_quality (659 mentions), accessibility (563 mentions), and community (430 mentions).
The least discussed topics were error (131 mentions), notifications (47 mentions), data_and_privacy (34 mentions).
Binned BERT Sentiment scores for each topic of discussion
The results obtained from both sentiment analysis and zero-shot classification have been plotted together, providing a comprehensive overview of each of the ten topics of discussion that were investigated.
This following collection of ten plots allows for interactive exploration, enabling comparison based on the following criteria:
Zero-shot Relevancy Score (X-axis): Indicates the extent to which the review is considered relevant to a specific topic, ranging from unrelated (0) to strongly related (+1).
BERT Sentiment Score (Y-axis): reflects the overall sentiment of the review, from very negative (-1) to very positive (+1).
User rating: indicated by the colour of the glyphs.
Review length: represented by the size of the glyphs.
Review content: accessible by hovering on the glyphs.
🫧 Data cleaning and preprocessing
Raw dataframe
The dataframe comprises 6,826 user reviews regarding the Medium application, each uniquely identified by a rev_id, with no duplicates or null values present.
The reviews span a complete year from October 15, 2022, to October 15, 2023 covering each of the 366 unique dates within the stated range.
| Column | Non-Null Count | Dtype | Description |
|---|---|---|---|
| rev_id | 6826 | object | Unique alphanumeric review ID (primary key) |
| rev_date | 6826 | datetime64[ns] | Review publishing date |
| USR_rat | 6826 | uint8 | Numerical rating provided by the user within the range of 1 to 5 |
| rev_text | 6826 | object | The written review provided by the user |
| word_cnt | 6826 | int64 | The word count within the review text |
Initial dataframe df structure
A total of 6826 records
366 unique dates, ranging from 2022-10-15 to 2023-10-15
0 duplicated reviews IDs
0 null values were identified within the dataframe
Cleaning strategy
The cleaning strategy started with a search for duplicate values in the rev_id and rev_text columns. The integrity of the primary key, rev_id, is confirmed with no duplicates detected. Similarly, the rev_text field revealed no significant repetition in content.
The uniqueness and range of review dates has been validated.
Anomalies concerning review lengths, specifically those with word counts of 50 or more (300 records), were individually examined. This inspection led to two notable observations:
Some reviews appeared to be comments on specific articles rather than on the app itself.
A number of reviews contained content seemingly unrelated to the app or its articles, such as religious quotes.
Cleaning process
The task of identifying every review that digresses onto unrelated topics was deemed beyond the scope of this project.
Two of the several approaches for filtering out reviews referencing individual articles involved:
Selecting reviews containing any of the terms "you", "your", or "thank you", and inspecting each of these 662 entries individually.
Implementing zero-shot classification on the rev_text field, applicable only for texts exceeding six words, using the labels: thanking, personal, article, comment, and name. The most prominent reviews in each category were then subject to individual review.
Following this method, 93 reviews were dropped from the dataset. The majority were excluded because they were identified as either commentary on articles or irrelevant digressions.
After cleaning, the dataframe now stands at a total of 6,733 entries.
Cleaning limitations
It's key to acknowledge that additional efforts could improve the identification of problematic reviews. These reviews, if left unchecked, will eventually distort the overall statistics and insights derived from the data.
Future improvements might include preemptive measures, such as clearer guidelines for users when submitting reviews, emphasizing the focus on the app rather than any articles read.
The refinement of the data cleaning strategy was not extensively pursued for several reasons:
The primary aim of this project is to collect qualitative feedback, which is achieved through sentiment analysis and zero-shot classification techniques.
The application of zero-shot classification in clustering reviews tends to naturally exclude those that are irrelevant to the predetermined labels.
Another key goal is to explore and refine the methodologies of sentiment analysis and zero-shot classification for research automation, rather than focusing purely on data cleaning.
An effective and efficient method to isolate comments on articles and off-topic reviews has not yet been established.
Considering these factors, it should be noted that any quantitative analysis presented in this report may not fully represent the data due to these identified data quality issues.
🗺️ Descriptive analysis
General dataframe statistics
| USR_rat | word_cnt | |
|---|---|---|
| count | 6733.00 | 6733.00 |
| mean | 4.29 | 10.10 |
| std | 1.27 | 17.76 |
| min | 1.00 | 1.00 |
| 25% | 4.00 | 2.00 |
| 50% | 5.00 | 4.00 |
| 75% | 5.00 | 11.00 |
| max | 5.00 | 283.00 |
Initial dataframe described
The cleaned dataframe contains 6,733 entries.
User ratings show moderate variability, with a standard deviation of 1.27. The ratings are fairly focused, with the lower 25% of users giving ratings up to 4.00.
Reviews have an average word count of 10.10, yet with a substantial spread as shown by the standard deviation of 17.76. Word counts range widely from 1 to 283, with the median sitting at 4 words, suggesting right-skewed data. The bulk of entries (75%) have 11 words or fewer, but the maximum word count stretches to 283.
User ratings distribution
inspect plot code
Reviews and user ratings trends
Review volumes peak in November 2022 and early January 2023, with more than 30 reviews per day and occasionally surpassing 40, as seen on January 14th, 2023. Conversely, the summer period shows lower activity, with daily reviews averaging between 8 and 18.
Review volume and average user rating from 2022-10-15 to 2023-10-15
inspect plot code
It's interesting to note that the average user rating tends to be higher and more consistent during times of high review volume, while it becomes lower and more variable during quieter periods. However, these observations may not directly reflect the dynamics of daily or monthly active users since the act of writing reviews might be triggered by different factors than those driving passive content consumption on the platform.
Words and reviews distribution
The majority of reviews contain fewer than a dozen words, indicating a trend towards brevity.
When examining the data grouped by date over 366 unique entries, we have 18.40 reviews posted daily on average, with a standard deviation of 5.68. The distribution of daily reviews is fairly symmetrical, as evidenced by the mean closely aligning with the 50th percentile.
| Column | Non-Null Count | Dtype | Description |
|---|---|---|---|
| date | 366 | datetime64[ns] | Date (primary key) |
| num_reviews | 366 | int64 | Total number of reviews published |
| tot_words | 366 | int64 | Total number of words written |
| avg_usr_rating | 366 | float64 | Average user rating |
| wrdrev_ratio | 366 | float64 | Average word count for each review |
date_df dataframe structure
inspect pandas code
There is considerable variation in the total word count per day, with a standard deviation of 88.87. On the least active day, only 27 words were recorded across 9 reviews (2023-06-07), while the most active day saw 495 words spread over 28 reviews (2023-12-26).
| num_reviews | tot_words | avg_usr_rating | wrdrev_ratio | |
|---|---|---|---|---|
| count | 366.00 | 366.00 | 366.00 | 366.00 |
| mean | 18.40 | 185.73 | 4.28 | 10.21 |
| std | 5.68 | 88.87 | 0.32 | 4.22 |
| min | 6.00 | 27.00 | 3.17 | 3.00 |
| 25% | 14.00 | 123.25 | 4.09 | 7.16 |
| 50% | 18.00 | 172.50 | 4.33 | 9.46 |
| 75% | 22.00 | 228.50 | 4.50 | 12.39 |
| max | 43.00 | 495.00 | 5.00 | 28.08 |
date_df dataframe described
Review lengths histogram
inspect plot code
The average user rating per day remains consistent, with an average daily rating of 4.28. The average words per review each day stands at 10.21, with a range from a minimum average of 3 to a maximum average of 28.08 words. This indicates significant fluctuation in the length of reviews day-to-day, with some days featuring very brief feedback and others providing more detailed commentaries.
Words-to-review ratio against average user rating
inspect plot code
Word cloud
Prior to generating the word cloud, English stop words, along with some additional common terms such as 'article', 'articles', 'app', and 'medium', were excluded from the review text corpus.

Word cloud after excluding english stop words
inspect word cloud code
The resulting visual representation predominantly showcases words with positive (e.g., good, love, nice) or neutral (e.g., platform, read, content) connotations.
This visualisation provides two key insights:
The overall high-level sentiment ranges from mildly to strongly positive.
It highlights focal points for further analysis through sentiment and zero-shot classification techniques.
Subsequent inspections might focus on the following:
How is the platform perceived by its user base?
What are the attitudes towards the subscription model, and to what extent is it accepted or rejected?
What sentiments are associated with the reading and writing experiences on the platform?
How do users rate the quality of content: do they find it low, sufficient, or high?
🙃 Sentiment analysis
VADER & BERT models
Two distinct methods were employed to analyse the sentiment of reviews: VADER and BERT.
VADER (Valence Aware Dictionary and sEntiment Reasoner)
VADER is a lexicon-based and rule-driven natural language processing (NLP) tool that provides a compound score reflecting the overall sentiment in a text.
This score, with two decimal precision, is derived by summing the valence scores of individual words, each labeled as positive or negative based on their semantic orientation. The score ranges from -1 (very negative) to +1 (very positive).
However, VADER may not accurately capture sentiment in texts with nuanced emotions or complex sentiment, especially where context is critical.
BERT (Bidirectional Encoder Representations from Transformers)
BERT is a deep learning model leveraging the Transformer architecture that does not rely on predefined lexicon valence scores, but rather understands the context of words in their sentence-wide relationships, enabling a more nuanced understanding of language and complex sentence structures.
However, BERT requires significantly more computational resources compared to VADER.
The output of this model is slightly different from VADER, as it provides five different values, each representing the probability that the text received the corresponding rating (from 1 to 5). For this reason, the results have been mapped to a single two-decimal precision value ranging from -1 (very negative) to +1 (very positive), making them easily comparable to its VADER counterpart (inspect code below for more information).
Compute sentiment
| v_rat | b_rat | |
|---|---|---|
| count | 6733.00 | 6733.00 |
| mean | 0.42 | 0.51 |
| std | 0.34 | 0.45 |
| min | -0.97 | -0.99 |
| 25% | 0.32 | 0.41 |
| 50% | 0.44 | 0.63 |
| 75% | 0.64 | 0.84 |
| max | 1.00 | 0.99 |
VADER and BERT sentiment scores described
computing VADER ratings
computing BERT ratings
Initially, BERT's ratings appear to be more positive compared to VADER's, suggesting a more generous sentiment, but further examination is needed.
The correlation coefficient between user ratings and VADER ratings is 0.39.
The correlation coefficient between user ratings and BERT ratings is 0.58.
These values indicate a stronger correlation between user ratings and BERT's ratings than between user ratings and VADER ratings, suggesting that BERT model aligns more closely with user ratings compared to VADER. This trend is not only statistically evident but can also be observed visually in the following plot.
Consistency analysis
A significant reduction in sensitivity is noticeable in VADER's ratings, particularly for short and neutral reviews. In contrast, the distribution of BERT's ratings aligns better with the user ratings, as evidenced by the distribution for each rating bin.
It is evident that the longer the review, the more accurately the BERT model predicts the rating assigned by users. This correlation between review length and predicted rating correctness is not observed with VADER's scores, indicating a potential limitation in its ability to analyse longer texts.
VADER and BERT Sentiment scores distributions compared to User ratings
inspect plot code
Interpretation
The BERT model's ability to understand context and link meanings of words together stands as a clear advantage over the VADER methodology.
This leads to a crucial difference between the two methods: as the length of a review increases in terms of word count, one model becomes less and less reliable while the other appears to be more accurate.
VADER's rating becomes increasingly unreliable for longer reviews, as it analyses words in isolation, often missing nuances and less explicit meanings.
BERT's rating, which comprehends context by linking word meanings within a text, shows higher consistency. This is visually evident, as only shorter reviews often misalign with user ratings, while longer reviews generally correspond closely.
For these reasons, BERT's rating was adopted as the sole sentiment analysis standard throughout this study.
An analysis of the interactive graph reveals certain reviews with contrasting features, such as highly negative texts paired with a 5-star rating. Two primary explanations for this are identified:
The user inadvertently selected the wrong rating.
They chose a positive/negative rating despite expressing a contrasting view, possibly due to constructive feedback or frustration with specific features.
These instances are not seen as limitations but rather as integral to the goal of this analysis: to cluster and analyze reviews based solely on their content.
🍱 Zero-shot classification
Model
In zero-shot classification, the model receives a text object and predefined target labels as inputs. The model then evaluates and assigns a score to each label, indicating the probability of the text being relevant to the corresponding target. This process enables the model to classify the text into categories that were not included in its original training data, from here the name zero-shot.

Example with 5 target labels on Hugging Face
Laurer, Moritz, Wouter van Atteveldt, Andreu Salleras Casas, and Kasper Welbers. 2022. ‘Less Annotating, More Classifying – Addressing the Data Scarcity Issue of Supervised Machine Learning with Deep Transfer Learning and BERT - NLI’. Preprint, June. Open Science Framework. LINK
Labels
Specific criteria have been established to ensure accuracy and relevance:
A minimum word threshold of six words has been set for a review to be eligible for text classification.
A review must achieve a label score of 0.7 or higher to be considered truly relevant to a specific topic or label.
In total, ten different labels have been investigated in this analysis:
compute zero-shot classification
2387 reviews resulted in being more than six words long. Runtime for computing 10 zero-shot scores for each of them was almost 2 hours and 30 minutes.
Results
After computing the ten label scores for all reviews with text lengths exceeding six words, the data were aggregated by label, indicating the number of records with a score of 0.7 or higher for each label under the tot_reviews.
| scores | tot_reviews | USR_rat_mean | b_rat_mean | neg_pct | mid_neg_pct | neu_pct | mid_pos_pct | pos_pct |
|---|---|---|---|---|---|---|---|---|
| Content Quality | 659 | 4.52 | 0.59 | 3.95 | 5.31 | 6.07 | 15.93 | 68.74 |
| Accessibility | 563 | 4.13 | 0.43 | 7.46 | 10.30 | 9.59 | 16.16 | 56.48 |
| Community | 430 | 4.45 | 0.59 | 3.95 | 5.81 | 5.81 | 14.88 | 69.53 |
| User Interface | 348 | 3.62 | 0.22 | 14.94 | 16.67 | 13.51 | 10.92 | 43.97 |
| Customization | 254 | 4.00 | 0.35 | 5.91 | 10.24 | 17.72 | 22.05 | 44.09 |
| Money and Subscription | 203 | 2.94 | -0.08 | 25.12 | 25.12 | 15.76 | 13.30 | 20.69 |
| Feature Request | 164 | 3.44 | 0.05 | 10.98 | 21.34 | 28.66 | 21.34 | 17.68 |
| Error | 131 | 2.07 | -0.54 | 47.33 | 37.40 | 12.98 | 1.53 | 0.76 |
| Notifications | 47 | 2.85 | -0.07 | 23.40 | 29.79 | 12.77 | 6.38 | 27.66 |
| Data and Privacy | 34 | 3.15 | 0.06 | 17.65 | 23.53 | 11.76 | 17.65 | 29.41 |
Binned BERT Sentiment scores for all zero-shot labels
tot_reviews indicates the number of reviews to which a score of 0.7 or higher have been assigned for that specific label.
USR_rat_mean represents the average user rating for such reviews.
b_rat_mean represents the average BERT's rating.
pct fields indicate the percentage of reviews which BERT's ratings fall under the following bins: [-1, -0.6, -0.2, +0.2, +0.6, +1].
Binned BERT Sentiment scores for each label
inspect plot code
Zero-shot scores histograms for each of the ten labels. Only scores greater than 0.7 were considered to be relevant
Content quality
659 reviews
USR avg: 4.52
BERT avg: 0.59
4%
5%
6%
16%
69%
Good source of varied content but full of junk that i'm pretty sure chat gpt wrote. Just put in the effort to find good authors and follow them.
Medium user
Success drivers
Articles suggestion algorithm
Learning experience thanks to informative content
Thriving tech community
Complaints
Writers reliability and authority
Content paywall
Grammar mistakes throughout articles
With a total of 659 records, content quality is the most discussed topic among the ones that have been investigated
These reviews have also the highest average user rating (4.52), and this is reflected also by the average BERT rating (0.59).
A large majority (68.74%) of reviews are positive, with a very small portion being negative (3.95%). This supports the high user rating and BERT sentiment score.
Accessibility
563 reviews
USR avg: 4.13
BERT avg: 0.43
7%
10%
10%
16%
56%
I tried to take medium at 50% off, but i am visually impaired and could not determine how to purchase at that rate. [...] I used the email address from the google playstore to contact you previously, asking about a lifetime purchase option and other questions pertaining to visually impaired persons and medium’s accessibility, and such. I received no answer and was directed to the medium website. [...] I still have been ignored.
Medium user
Success drivers
Centralised access to a diverse set of knowledge niches
Good overall reading experience on mobile
Articles are generally easy to understand and digest
Complaints
Writing editor features are perceived as lacking, unreliable and unintuitive
Insufficient support for a tablet version of the app
Isolated complaints on contrast and general visual accessibility
A substantial amount of reviews (563) is related to accessibility, yet this value may not be as relevant as we hope. In this category, the accessibility label might not be specific enough to identify what is commonly referred to accessibility in UX/UI terms.
For instance, we can see that problems in accessing the platform are accounted in this category, yet we can identify some relevant issues related to UX/UI accessibility, such as the one reported here.
Both average user rating and average BERT rating have high scores in this category, respectively 4.13 and 0.43.
The majority of sentiment distribution is positive (56.48%), but with a not-negligible amount being either negative or slightly negative, 7.46% and 10.30% respectively.
Community
430 reviews
USR avg: 4.45
BERT avg: 0.59
4%
6%
6%
15%
70%
A fabulous resource for finding brilliant creatives, informed advice, and a vast range of readily readable items on just about any topic you care for. As an amateur writer, some enhanced opportunity for feedback and actually being able to analyse statistics on how my contributions are seen & received would be a great enhancement, but medium is excellent and i can recommend it.
Medium user
Success drivers
Great sense of feeling part of a community
Effective compartmentalisation of specific interest areas
Learning is a major factor that fosters connections among users
Complaints
Not being a paying member can lead users to feel left out of the Medium community
This label was not capable of identifying consistent and relevant reviews referring the community that revolves around the platform, thus discussing quantitative data might not be as insightful for this category.
However, some insightful reviews can be still recovered by exploring the corresponding graph.
User interface
348 reviews
USR avg: 3.62
BERT avg: 0.22
15%
17%
14%
11%
44%
Decided not to renew. Stories are good but the app sucks. Years of complaining that you can't read on some small devices and can't scale text, and nothing's been done. You plan on using a mobile device don't bother supporting this group. Very disappointed they they don't really seem to care about their customer's experience.
Medium user
Success drivers
The uncluttered and minimalistic interface is very well perceived
Ad-free interface
Text and images focused experience with a digestible layout
Complaints
Tablets and some Android devices experience inadequate support, ranging from the absence of landscape mode to the inability to scale text properly
Unexpected app behaviour concerning the back button, particularly related to the scroll state of the previous page
The application lacks options for filtering and sorting search results
Despite the label's wording being possibly too specific for general users to reference (and thus for the model to identify reviews related to the topic), a substantial number of reviews (348) were categorised under this label.
An overall lower average user rating (3.62) and average BERT rating (0.22) is noted compared to the whole dataset’s averages (4.29 and 0.51), indicating a clear potential for improvement upon detailed qualitative inspection.
The sentiment distribution reflects this trend, with positive percentage dropping to 43.97%, and a notable increase in negative (14.94%) and slightly negative (16.67%) sentiments.
Customization
254 reviews
USR avg: 4.00
BERT avg: 0.35
6%
10%
18%
22%
44%
The quality of the results within this label is reported to be extremely insufficient, thus no further analysis would be relevant for this category.
Money and subscription
203 reviews
USR avg: 2.94
BERT avg: -0.08
25%
25%
16%
13%
21%
Always ask for premium which distract me more. As a student I can't afford that amount for this subscription. This is a good app but the premium feature is many time make my knowledge lemited.
Medium user
Success drivers
Premium content is very well perceived from subscribed users
The writers-supporting business model is well perceived from users
Complaints
Reported issues accessing premium content after subscribing
Some users requests student pricing, although it's already available
Users complain about an increasing number of member-only stories on their homepages
The model was extremely successful in identifying reviews that discuss topics related to the subscription model of the platform, and the results are considered to be optimal. A total of 203 reviews are reported to discuss the topic.
A significantly lower average user rating (2.94) and average BERT rating (-0.08) are observed compared to the entire dataset (4.29 and 0.51)
This category has the second highest percentage of aggregated negative and slightly negative reviews at 50.24% (25.12% + 25.12%).
Feature request
164 reviews
USR avg: 3.44
BERT avg: 0.05
11%
21%
29%
21%
18%
Dark mode has poor contrast and the app doesn't reliably remember which articles I was reading or where I left off. Please use the saved instance state to resume where i left off and adhere to accessibility best practices to improve readability.
Medium user
Most requested features
Audio reader is well perceived and more improvements would be very well appreciated
Selecting it as default option
Auto-scroll
Words automated highlighting
Text customisation and responsive layout need improvements
No landscape option
Clipping text on certain Android devices
Better filtering and sorting options
Article length
Popularity
Free/paid-article
Better writing and editing features
Custom spacing
Version history
Preview
Despite the low absolute number of reviews (164) explicitly discussing new features requests, the results are considered to be very relevant to the label investigated, and offer great insights on what could be the evolution of the platform from the users’ perspective.
Average user rating and average BERT rating reflect mixed feelings for this category, being 3.44 and 0.05 respectively.
The sentiment distribution reflects this aspect, showing a very evenly spread sentiment across the spectrum. Negative: 10.98%, slightly negative: 21.34%, neutral: 28.66%, slightly positive: 21.34%, positive: 17.68%.
Error
131 reviews
USR avg: 2.07
BERT avg: -0.54
47%
37%
13%
2%
1%
Unable to view stats. For many months i've been getting an error message when trying to view stats from my phone. I'm sure I'm not the only one affected by this issue since it has followed me across 2 different phones.
Medium user
Success drivers
Complaints
Crashes and bugs while writing and editing articles
Errors related to sign-ins/ups with Google
Errors accessing the comments section
As expected, a very low average user (2.07) and BERT rating (-0.54) are observed with the error category across all the 131 reviews that discuss about this topic.
The highest aggregated percentage in negative and slightly negative sentiments at 84.73% (47.33% and 37.40%) by far, reflecting strong user frustration.
Notifications
47 reviews
USR avg: 2.85
BERT avg: -0.07
23%
30%
13%
6%
28%
The daily notification of articles to read are: 1. Recommended to perfection 2. Well-written content 3. Not repetitive very useful for a pm daily read.
Medium user
Success drivers
Implementing reminders for users about their saved articles could potentially foster increased engagement
Complaints
Notifications are considered intrusive by a small subset of users
A niche, yet insightful, concern (47 reviews) is reported within the notification system of the platform.
The low average user rating (2.85) and neutral average BERT rating (-0.07) reflect a sentiment distribution more towards the negative side of the spectrum, with 23.40% of the reviews being negative, and 29.79% being slightly negative.
Data and privacy
34 reviews
USR avg: 3.15
BERT avg: 0.06
18%
24%
12%
18%
30%
Deep links, as in opening a medium article from google chrome search results, does not work with duckduckgo app tracking protection enabled.
Medium user
Further analysis has not been conducted due to the scarcity of records in this category.
📤 Contacts
Hello friend! Thank you for taking the time to read this case study. If you have questions or feedback, or would otherwise like to get in touch, I look forward to hearing from you :)
It seems that you are accessing this page from either a tablet or a mobile :(
It appears that you are accessing this page from either a tablet or mobile :(
It appears that you are accessing this page from either a tablet or mobile :(
Case Study
Medium: UX research
A sentiment and zero-shot classification analysis on user reviews
Please come back from desktop to interactively explore this case study!
Please come back from desktop to explore this case study interactively!
Please come back from desktop to explore this case study interactively!